
How to Detect Fake Online Reviews using Machine Learning
Introduction
Since Yelp’s early days, reviews are one of the most important factors customers have relied on to determine the quality and authenticity of a business. A local consumer review survey published last year shows that 90% of consumers used the internet to find a local business in the previous year, and 89% of 35–54-year-olds trust online reviews as much as personal recommendations. Although Yelp’s listings often have hundreds or thousands of reviews, many of those reviews can’t be trusted.
“Fake reviews can be devastating to a brand. Simply put, once shoppers suspect a company of having fake reviews, trust is in question. In an era of misinformation and fake news, brand integrity is essential to building consumer trust, which directly translates to profit.”
— Joe Rohrlich, chief revenue officer at Bazaarvoice
Current research has found that around 20% of reviews on Yelp are estimated to be fake written by paid human writers [1]. In order to provide users with more reliable review information, Yelp uses automated software to determine which reviews are trustworthy and recommend those reviews to the Yelp community. But how do they build it? As a Data Science Intern at ScoreData, I wanted to build a solution for eCommerce companies to spot fake reviews. ScoreData has launched a self-learning predictive analytics SaaS platform, ScoreFast™, which allows customers to start analyzing data using machine learning in minutes. ScoreData also offers more personalized solutions to customers. If you are interested to know more about what we do, visit our website for more information.
Project Workflow
- Feature Engineering
- Choosing the metric
- Anomaly Detection on text data with Deep Learning Neural Network
- Outlier Detection with Isolation Forest using user activities
- Deal with Imbalanced dataset
- Models Evaluation
- Feature Importance
The dataset is collected from Yelp.com and firstly used by Rayana and Akoglu [2]. It includes product and user information, timestamp, ratings, and a plaintext review.
The original dataset is skewed. It has 608k+ restaurant reviews gathered from Yelp.com for NY, NJ, VT, CT, and PA. There exist 13.22% of fake reviews and 86.78% of truthful reviews. In this project, I first extracted user-behavior features [3] from reviews and reviewers’ information, such as the average review length for each user and the maximum number of reviews in a day for each user. I then applied both supervised and unsupervised learning methods on user behavior data and reviewed data to see which method and dataset performed better.
Feature Engineering
Here are some features I generated.
**Review-centric features**
- Length of the review
- Average word length of the reviewer
- Number of sentences
- Average sentence length of the reviewer
- Percentage of numerals
- Percentage of capitalized words
- Percentage of positive/negative opinion bearing words in each review.
**Reviewer-centric features**
- Maximum number of reviews in a day
- Percentage of reviews with positive/negative ratings
- Average review length
- The standard deviation of ratings of the reviewer’s reviews
**Review-Text features**
I converted each review into a 100-element numerical representation (text vectors) using the Word2Vec, a pre-trained neural network model that learns vector representations of words.
Choosing the Right Metric
There are many evaluation metrics to choose from when creating a classification model in machine learning. The common metrics are accuracy, precision, recall, F1 score, and AUC-ROC score. Before we go further, it’s important to understand what false positives and false negatives are. False positive happens when the model predicts an observation as a real review, but it’s actually fake, while false negative occurs when a truthful review is incorrectly classified as fraudulent. In statistical hypothesis testing, a type I error rate is the probability of rejecting the null hypothesis when it’s true (also known as a “false positive”). On the other hand, a type II error rate is the probability of failing to reject the null hypothesis when it’s false (also known as a “false negative” ).
- Accuracy: (TP+TN)/ (TP+FP+TN+FN) how many observations did the model classify correctly
- Precision: TP/(TP+FP) how many actual positive observations can the model capture from all the predicted positive cases.
- Recall: TP/ (TP+FN) how many observations did we correctly classify as positive out of all the positives in the dataset?
- Specificity: TN/(TN+FP) how many negative observations did we correctly classify as negative out of all the negatives in the dataset?
- F1 score: It is the harmonic mean of precision and recall.
- AUC-ROC: the ROC curve is plotted with the true positive rates (TPR) against the false positive rates (FPR) where TPR is on the y-axis, and FPR is on the x-axis. It summarizes the trade-off between TPR and the FPR for a predictive model using different probability thresholds. This metric tells us the predictive power of the model. The higher the AUC is, the better the prediction power the model has.
We don’t want false positives to be high because fake reviews can damage Yelp’s brand. As consumer trust continues to decline, the churn rate might increase. However, if false negative is high, it can lead to poor user experience, leading to a low user retention rate. As a result, we would use AUC-ROC as the classification model comparison metric because it can determine a prediction model’s performance. Since it’s hard to compute an AUC-ROC score from a confusion matrix, we would use specificity scores to compare both unsupervised and supervised models.
Anomaly Detection with Deep Learning Neural Network
Anomaly detection techniques can be applied to resolve various challenging business problems. For example, it can detect fraudulent insurance claims, travel expenses, purchases/deposits, bots that generate fake reviews, and so on. The hypothesis is that anomalies only occur very rarely in the data, and their features differ from the normal instances significantly. It’s similar to the outliers in Gaussian distribution, and anomalies are the data points far away from the mean of the population.
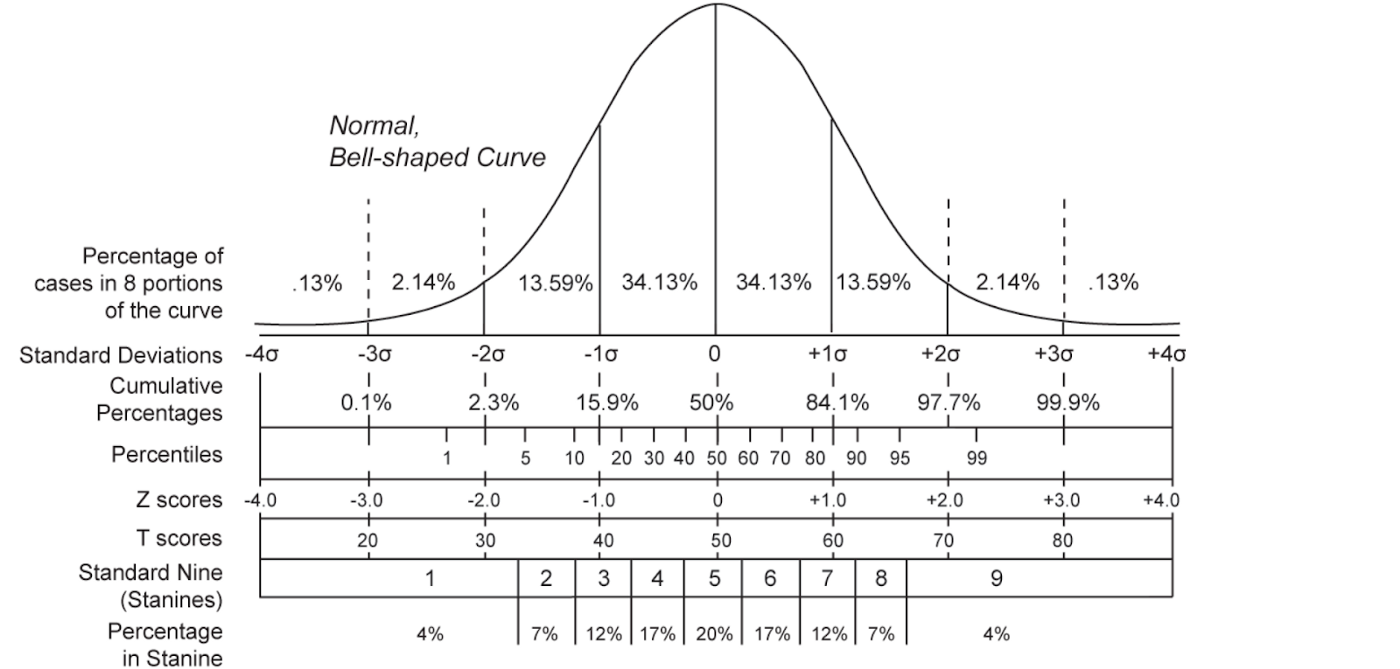
To illustrate how anomaly detection works, I used Gaussian distribution as an example. Notice that the distribution of reviews does not need to follow Gaussian distribution. As shown in the image above, about 68% of measurements will be within one standard deviation of the mean, and about 95% of measures will be within two standard deviations of the mean. Any z-score greater than 3 or less than -3 (outside of two standard deviations of the mean) is considered as an outlier. In other words, the further away from the center, the higher probability of being an outlier. As a result, we can use z-score as a benchmark in the unsupervised learning system to determine whether the anomaly detection method is feasible in the dataset.
I’d like to thank Dr. Moidin Mohiuddin, CTO of ScoreData, for introducing this method to me. As an experiment, we only used about 20,000 rows to create a text vector because it would take a long time to convert 608k+ reviews to a vector. After using the Word2Vec model, we turned the reviews into a vector. We first separated this vector into training and test sets, where the training set only contains truthful reviews, and the test set only includes the fake reviews (minority). Then we standardized the entire text vector using (x(i)-mean(x(i))/SD(x(i)), where i refers to the row number and x refers to the text vector. After that, we passed the standardized X vector into a Deep Learning neural network to create an approximation of it; the approximated output is Y. Next, we compute the error term MSE e(i) = mean of (y(i)-x(i))² over all rows, and the standard deviation of all error terms. Now we can use the square roots of MSE (RMSE) and SD for the outlier test. If the RMSE/SD (z-score) is greater than 3 or less than -3, then we say it is an outlier, hence spam.
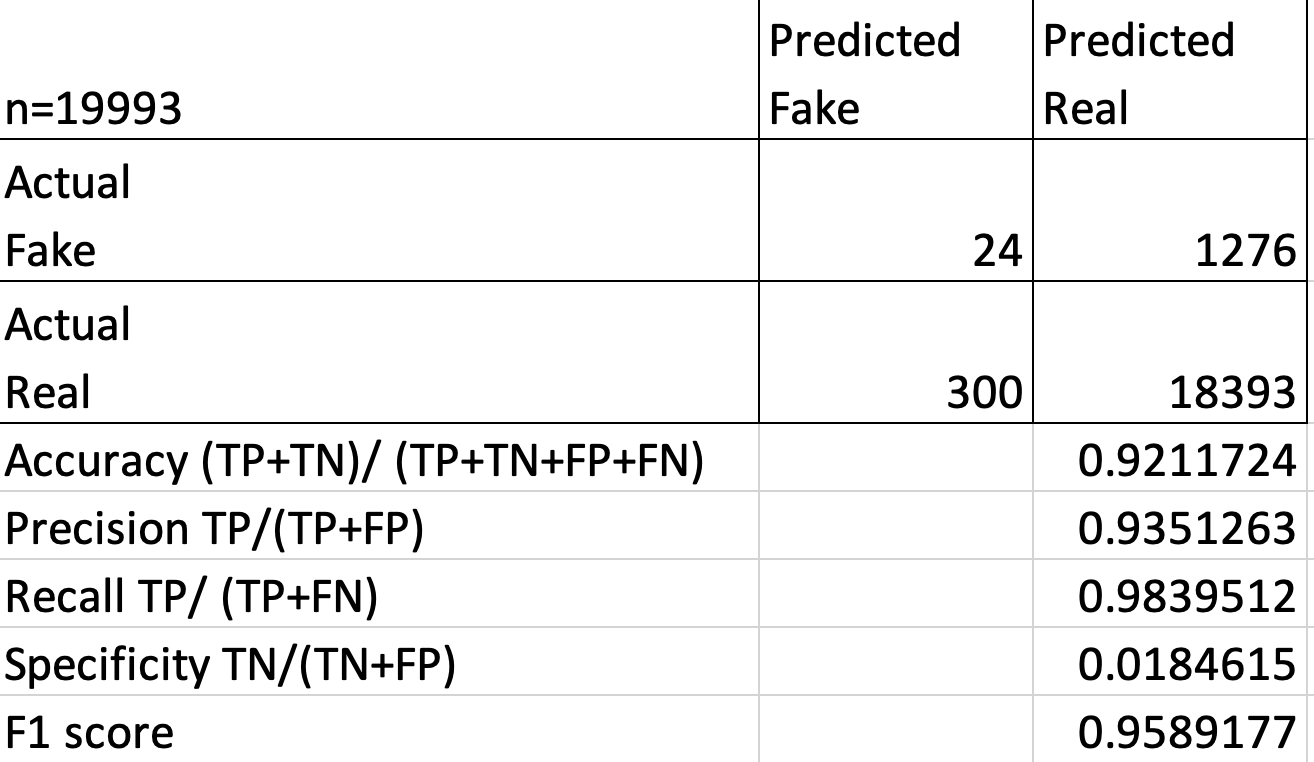
As shown above, the specificity score is very low. This means this method has trouble finding fake reviews. But since the F1 score is very high, this method can correctly classify real reviews. Let’s try out the Isolation Forest method on users’ behavior data to see if the result is better.
Outlier Detection with Isolation Forest
Similar to the z-score, Isolation Forest also calculates a score to detect anomalies. The way it works is similar to the Random Forest. It randomly picks subsets of features and builds decision trees for each subgroup. In each tree, partitions are created by randomly selecting a feature and then split the data based on a random value between the minimum and maximum value of the selected feature. Using such random partitioning, we can spot the outliers since they get to be isolated in fewer steps than normal behaviors.
The anomaly score is defined as:
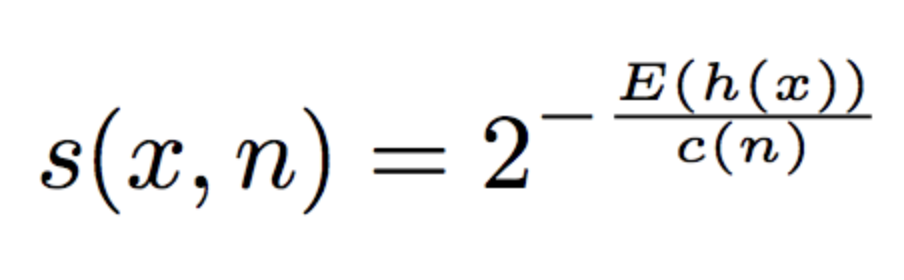
where E(h(x)) is the average path length (average of h(x)) from a collection of isolation trees.
- If the score is very close to 1, then they are anomalies.
- If the score is much smaller than 0.5, they are relatively safe to be regarded as normal instances.
- If all the instances return around 0.5, then the entire sample does not have any distinct anomaly.
I split the whole 608k+ user behavior dataset into training and test sets. Here’s the result:
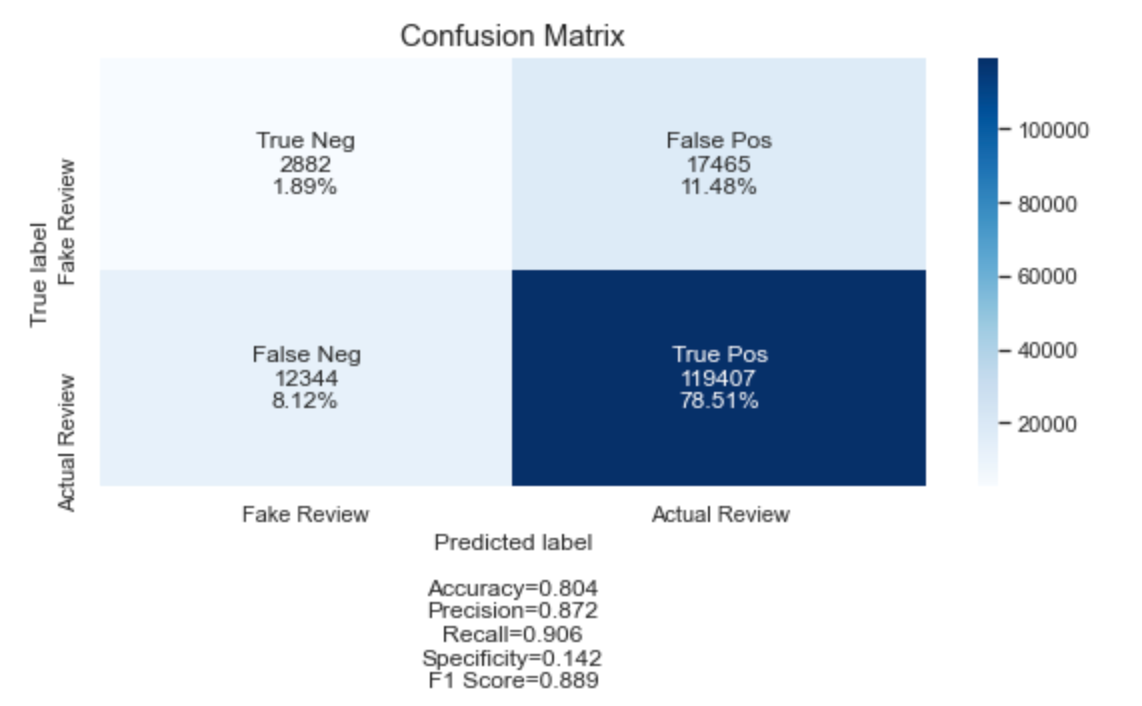
It looks like the specificity score is higher than the anomaly detection with Z-Score. However, this specificity score is not ideal. We can see that the false positive is more than 10%. Next, we will try the supervised learning method to see if it will give us better results. We want to do this experiment for the purpose of the blog, even though in real-world situations we rarely get data that has been labeled as spam and not spam.
Deal with Imbalanced Dataset
As mentioned before, 86.78% of the data in this dataset is labeled as truthful reviews, and the remaining 13.22% are cases of fake reviews. Clearly, this dataset is very imbalanced. Now say our model ends up as classifying everything it sees as truthful. If we use accuracy as a model evaluation metric, the score will be 86.78%. But we care more about those fraudulent cases. Therefore, we often need to balance the dataset before we build a classification model.
1. Up-sample Minority Class
This method uses synthetic data generation to increase the number of samples from the minority class in the data set.
SMOTE (Synthetic Minority Over-Sampling): first, it finds the n-nearest neighbors in the minority class for each of the samples in the class. Then it draws a line between the neighbors and generates random points on the line.
ADASYN (Adaptive Synthetic Sampling): similarly to SMOTE, but it only creates synthetic data in the boundary where it’s hard to define.
2. Down-sample Majority Class
In this method, we downsize the actual data set in such a way that the ratio of the dependent categories becomes 10:1. The disadvantage of using this method is that we reduce the data set, thus giving the model fewer data to feed on.
Classification Model Comparison
Since it would take a long time to convert the review into text vectors, I only applied the upsampling technique on the user behavior dataset.
Upsampling Method (SMOTE)
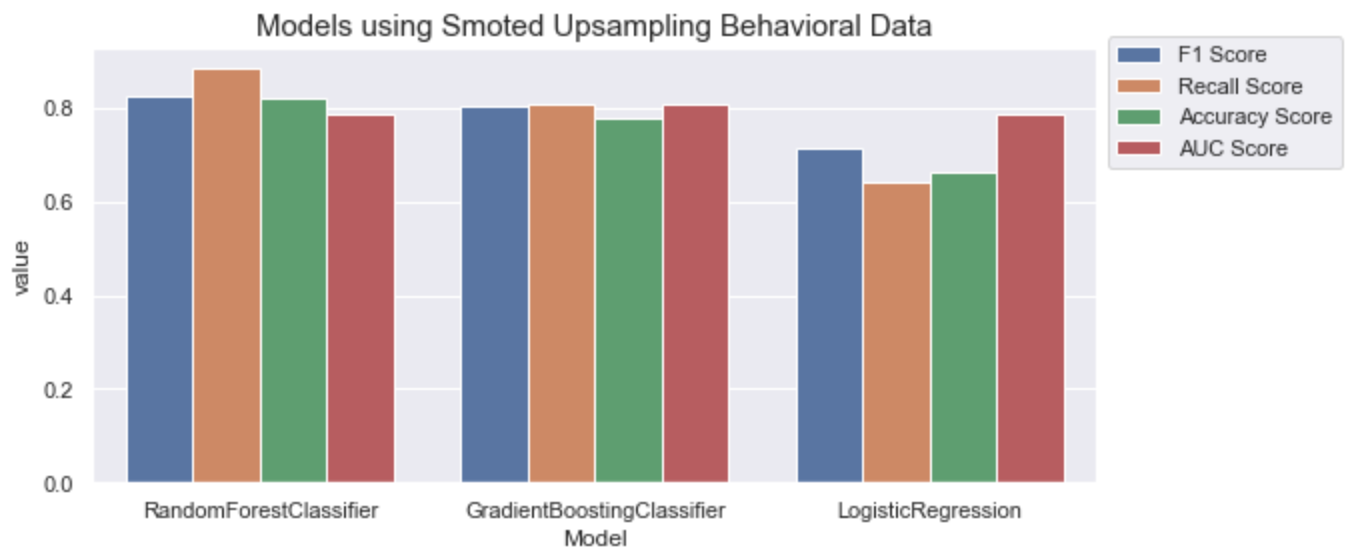
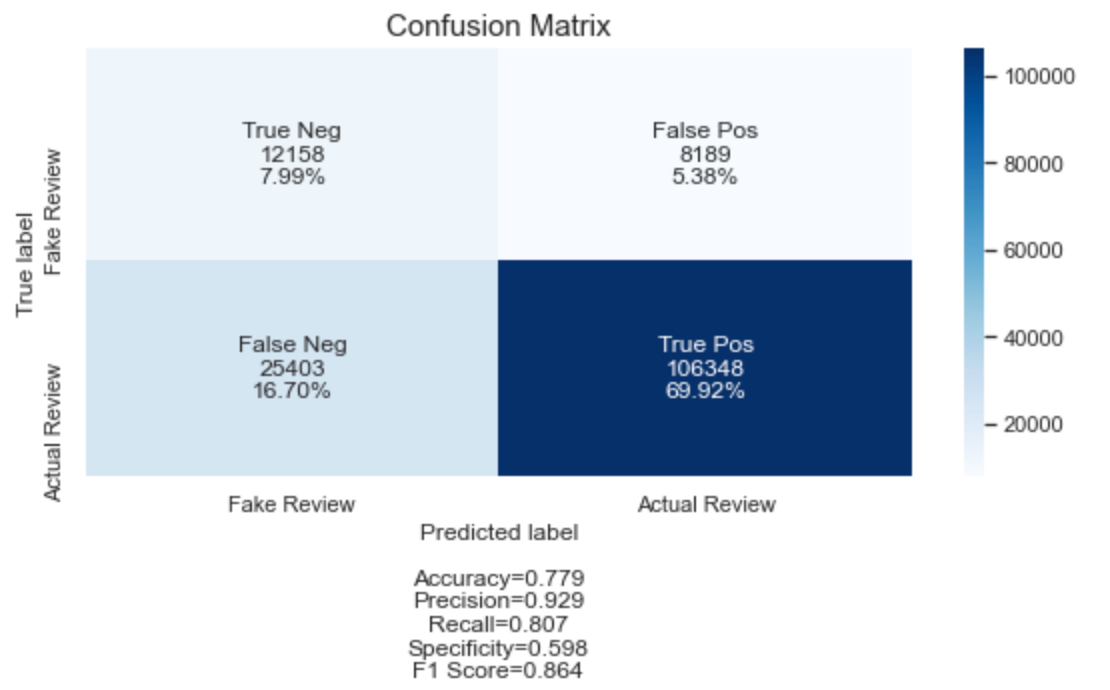
We can see that Gradient Boosting has the highest AUC score. Here’s the confusion matrix of using the gradient boosting model on SMOTE behavioral data.
Upsampling Method (ADASYN)

The Gradient Boosting model also has the highest AUC score than others.
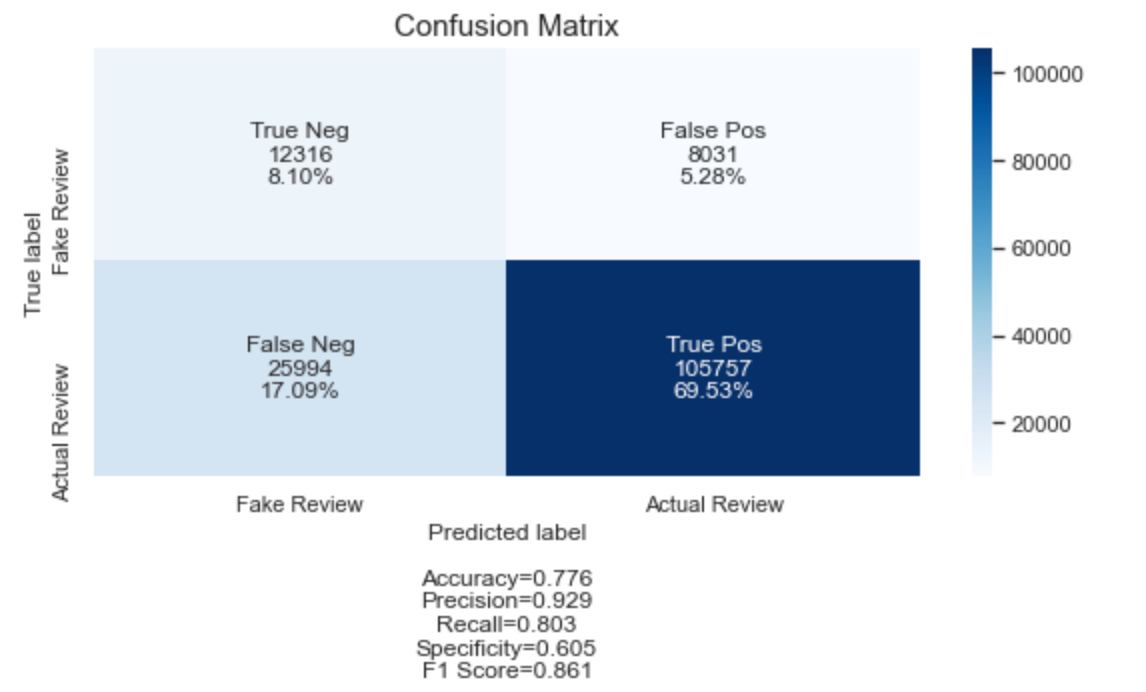
After comparing the Smote and Adasyn method results, we can see that they have similar AUC scores. Besides, both of them have higher specificity scores than unsupervised learning methods.
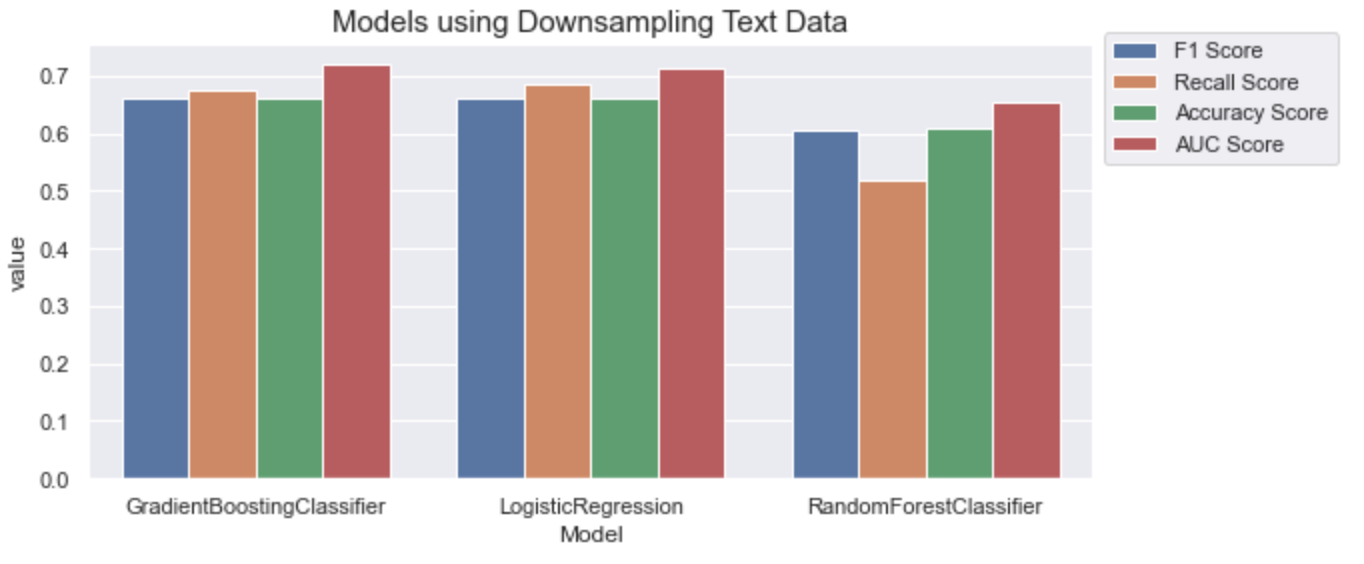
Downsampling Method (User Behavior Data)
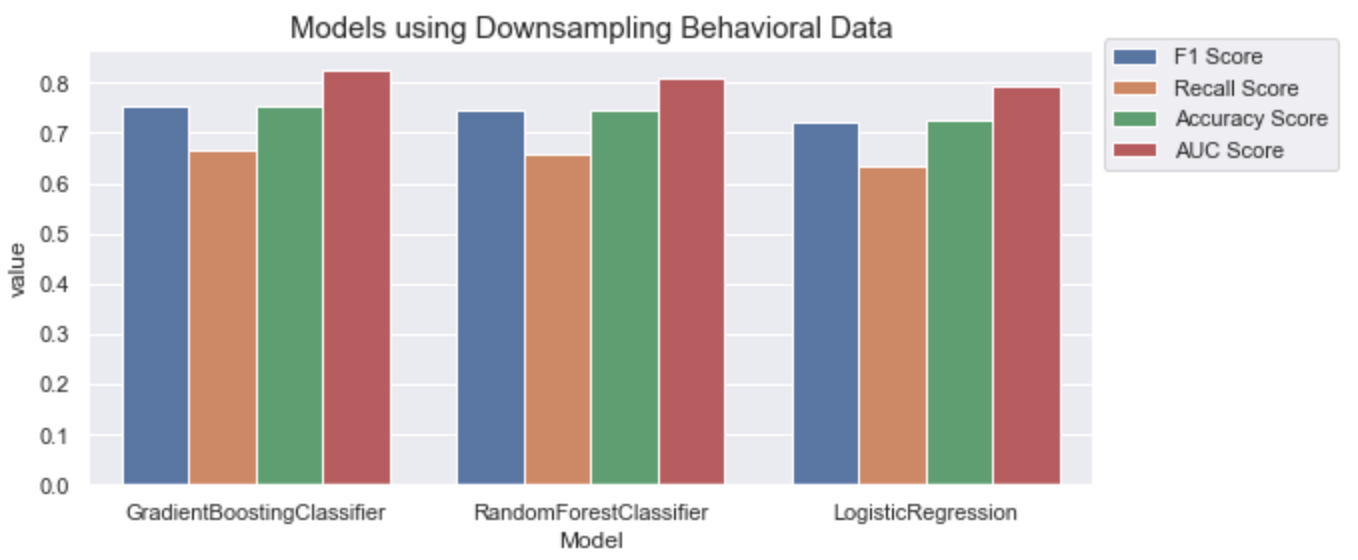
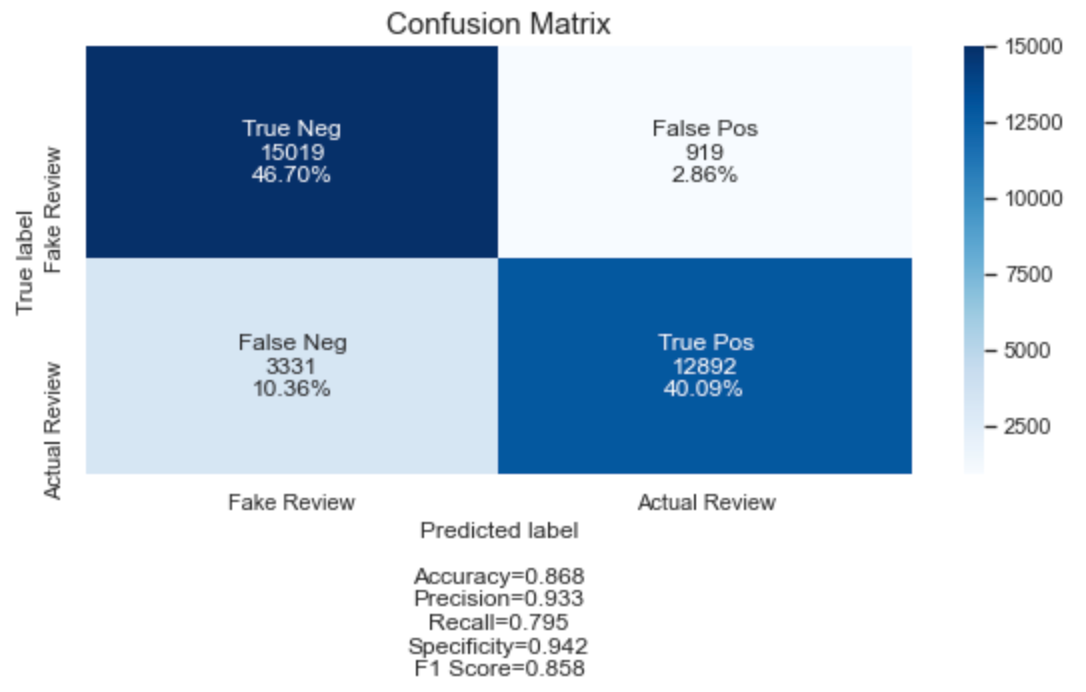
Clearly, the gradient boosting model has the highest scores compared to the rest of the models. Here’s the confusion matrix for the gradient boosting model.
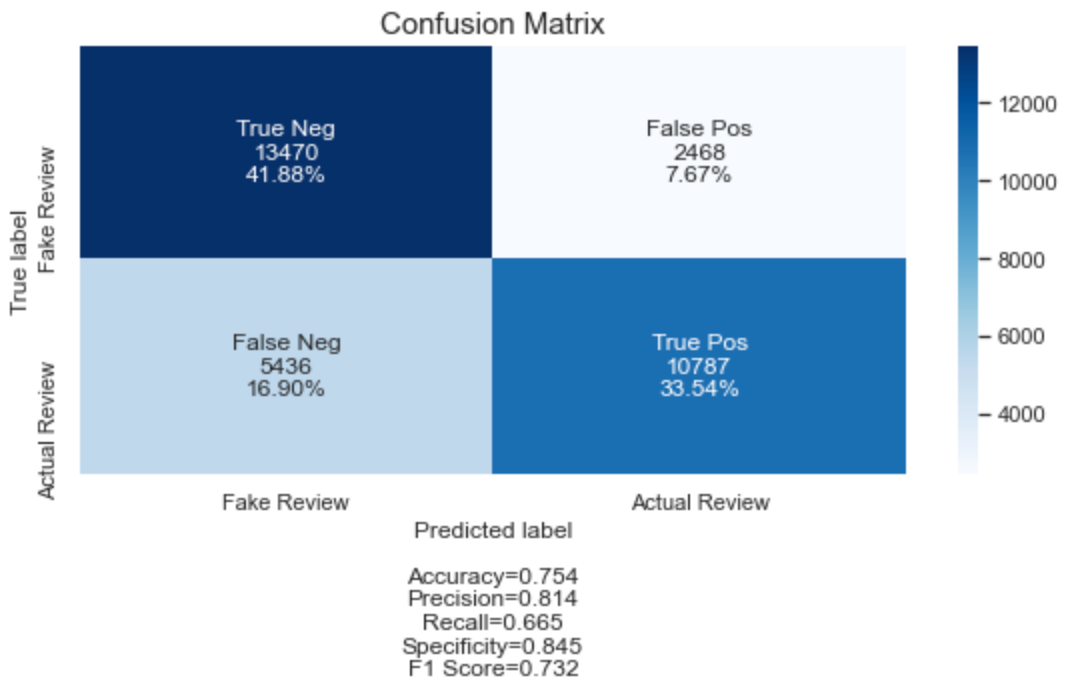
The AUC and the specificity scores are the highest among all the models we’ve tried so far. Let’s see if the text classification would perform better.
Text Classification
The gradient boosting model again has the highest AUC score, but it’s lower than the other AUC scores.
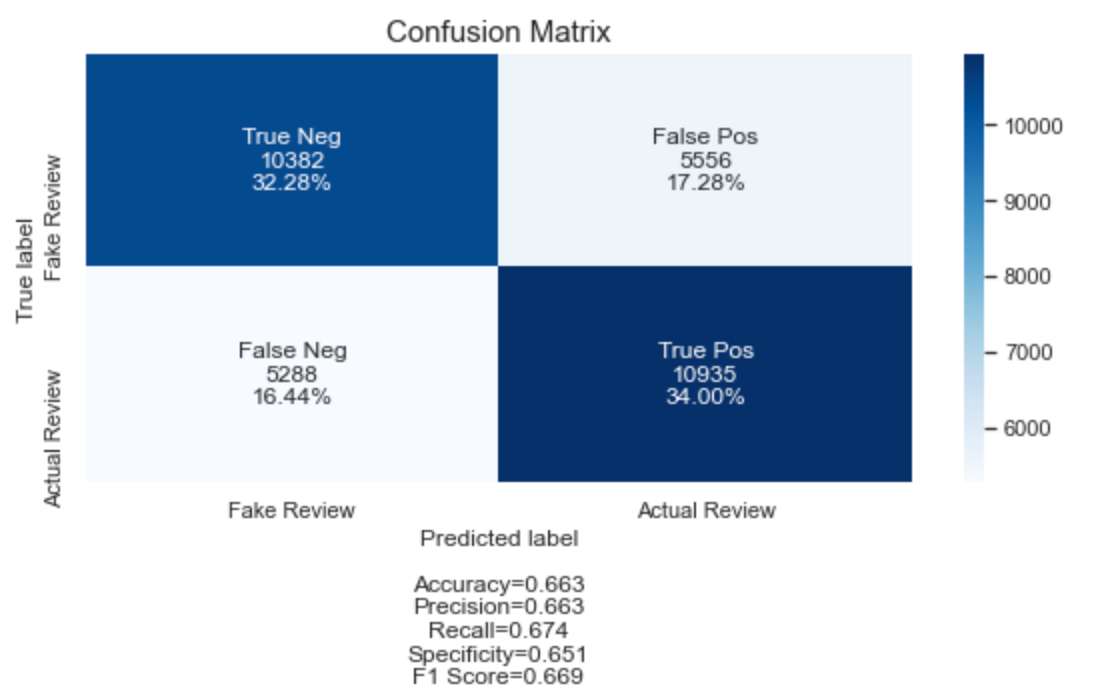
To sum up, user behavior dataset performs better in general.
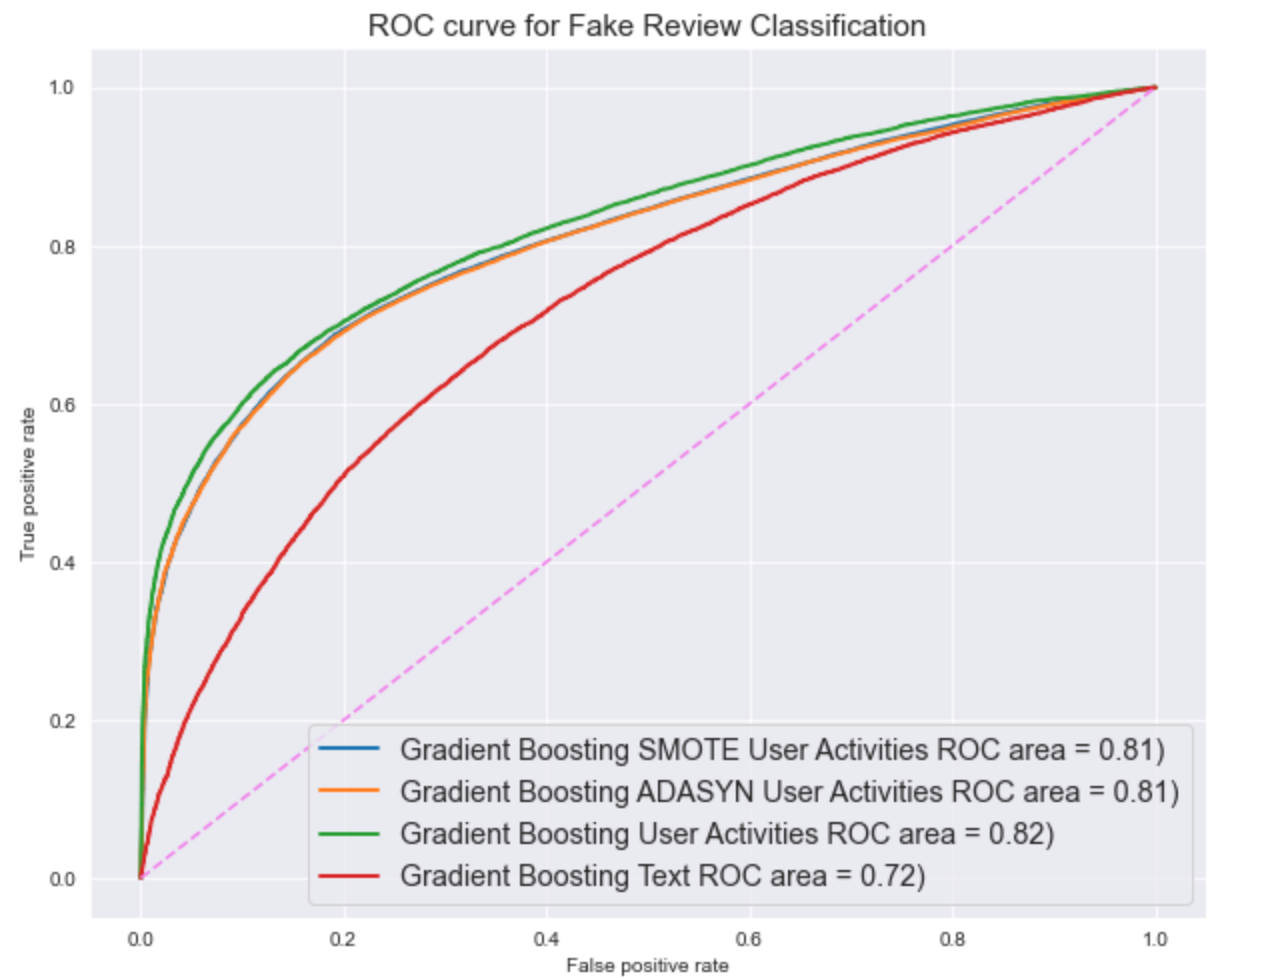
AUC-ROC Curve Comparison
Hyperparameter Optimization
After comparing the AUC scores across all the models, we can conclude that the gradient boosting model using downsampling behavioral data has the best performance. For the next step, we can use a tuning technique grid search to find the optimal hyperparameters to improve the model performance.
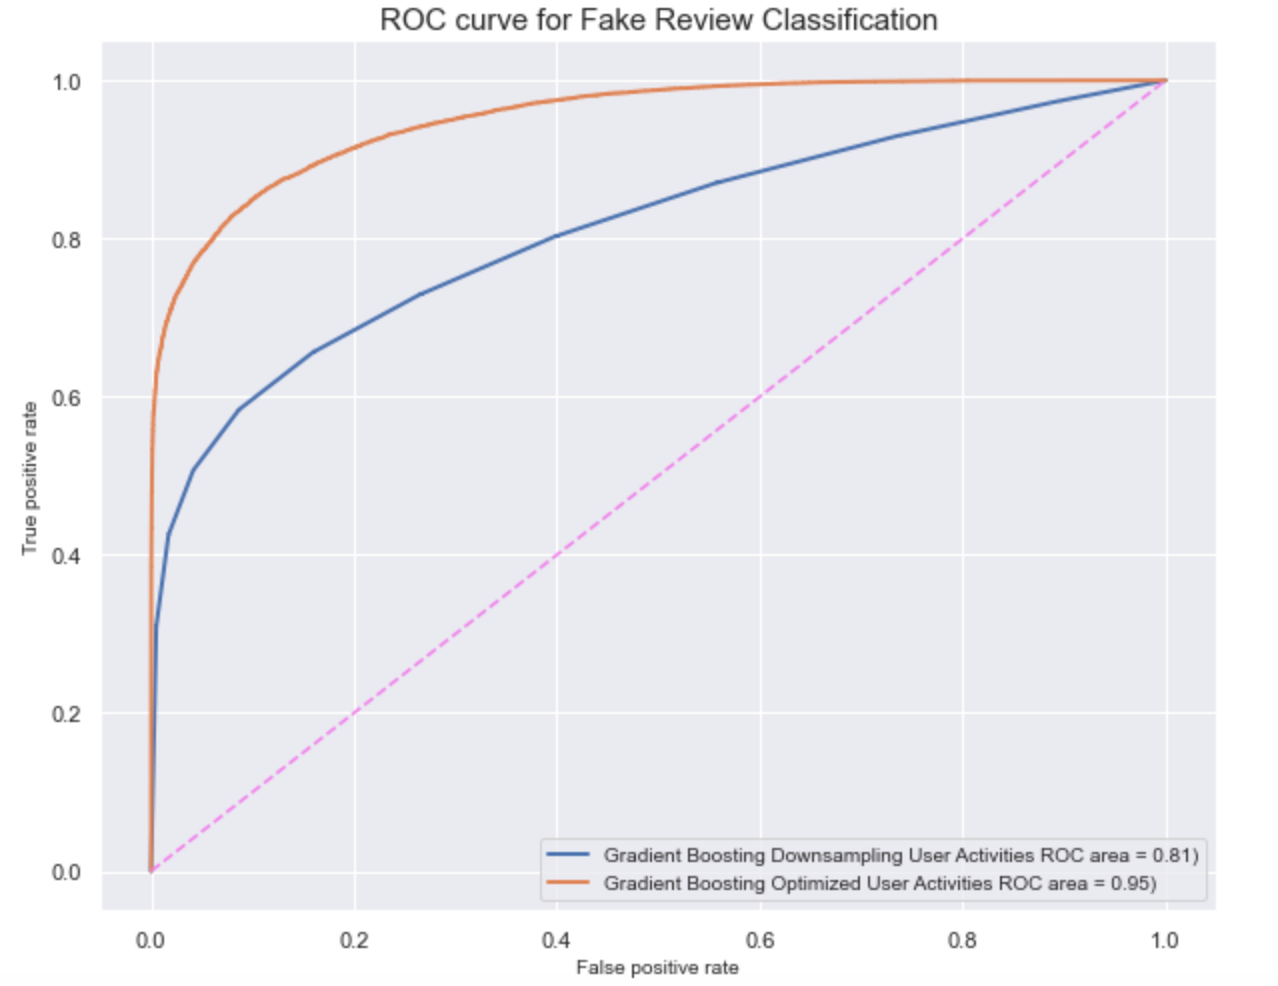
After optimizing the best model’s hyperparameter based on its AUC score, the model’s prediction power has improved by 17%.
Feature Importance From the Best Model
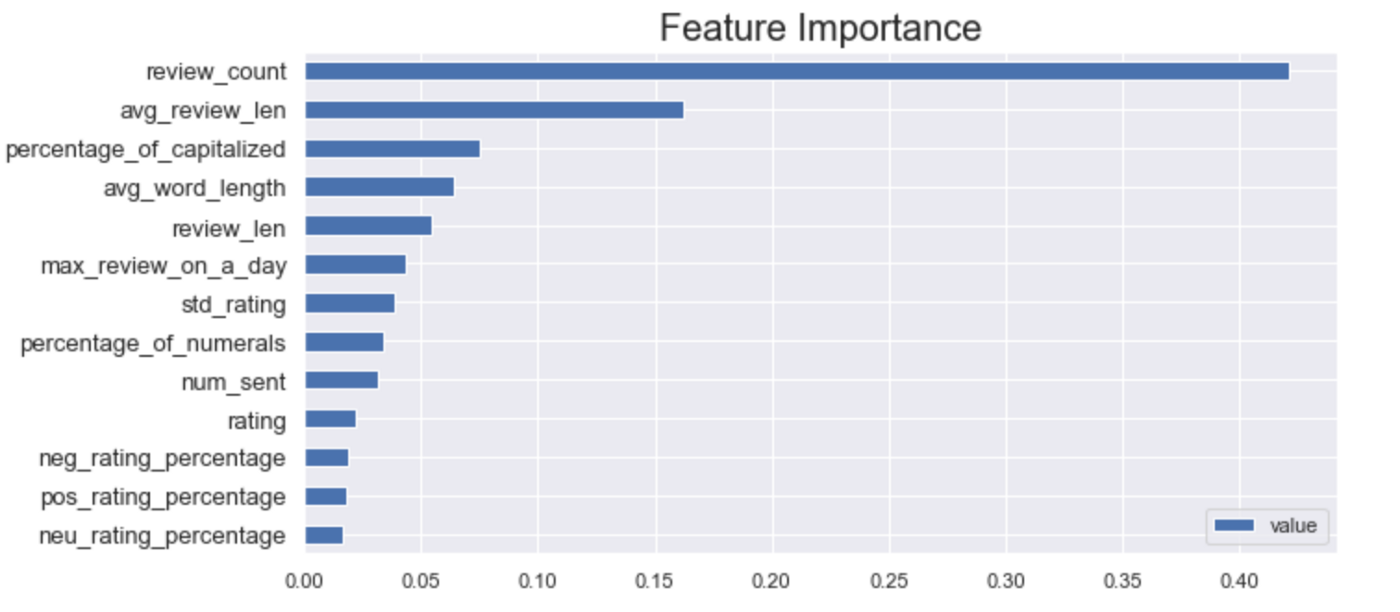
Based on the feature importance plot, we can see that the number of reviews a person posted and the average length of the reviews from a person are the main features that determine whether the review is truthful or not.
Conclusion
After experimenting with different datasets and several methods, we can conclude that using user behavior data is better than using text data when it comes to detecting fake reviews. One possible reason is that A.I. bots are better trained and now can write more human-realistic reviews, which make it even harder to catch fake reviews. Moreover, since it usually takes a long time to convert large amounts of text to vectors, using user activities data is way faster and more robust. In this dataset, we saw that supervised learning gives us better results; however, this result might not apply to other datasets, especially without prelabeled data. While the results might not stay the same, the explained approach in this article works on any unseen domain by using NLP and Machine Learning techniques.
Want to know more about how your business can benefit from anomaly detection and classification? Talk to our experts now!
Acknowledgment
I want to thank Moidin Mohiuddin, Kaushik Vasudevan, and the ScoreData team for giving me guidance and feedback on the blog.
Reference
[1] Yuanshun Yao, Bimal Viswanath, Jenna Cryan, Haitao Zheng, and Ben Y Zhao. Automated crowdturfing attacks and defenses in online review systems. arXiv preprint arXiv:1708.08151, 2017.
[2] Shebuti Rayana and Leman Akoglu. Collective opinion spam detection:bridging review networks and metadata. In ACM SIGKDD International Conference on Knowledge Discovery and Data Mining, pages 985–994, 2015.
[3] Nitin Jindal and Bing Liu. Opinion spam and analysis. In Proceedings of the 2008 International Conference on Web Search and Data Mining, pages 219–230. ACM, 2008.