
Building a Product Recommendation System for E-Commerce: Part II — Model Building
This blog is a continuation of my previous work¹, in which I talked about how I gathered product reviews and information through web scraping. I will now explain more about how I built the product recommendation system.
The Goals of this project were to:
- Gather product information and reviews data from BackCountry.com through web scraping using selenium, beautifulsoup (Part I)
- Perform an exploratory data analysis using ScoreFast™ platform
- Convert text data into vector
- Build a KNN predictive model to find the most similar products
- Run a Sentiment Analysis on product reviews
- Use each review’s sentiment score to predict its review’s rating
- Generate word clouds to find the customers’ pain points
Exploratory Data Analysis
Exploratory Data Analysis (EDA) is one of the crucial steps in data science because it allows us to understand the data better. ScoreFast™ enables users to create data reports using SQL queries and build dashboards using simple clicks. If you are interested to know more about our product, please check out our website.
I first defined the EDA questions I would like to answer with the data, then I created some visualization using both the ScoreFast™ platform.
Here are some EDA plots:
➡️ Dress Price Distribution
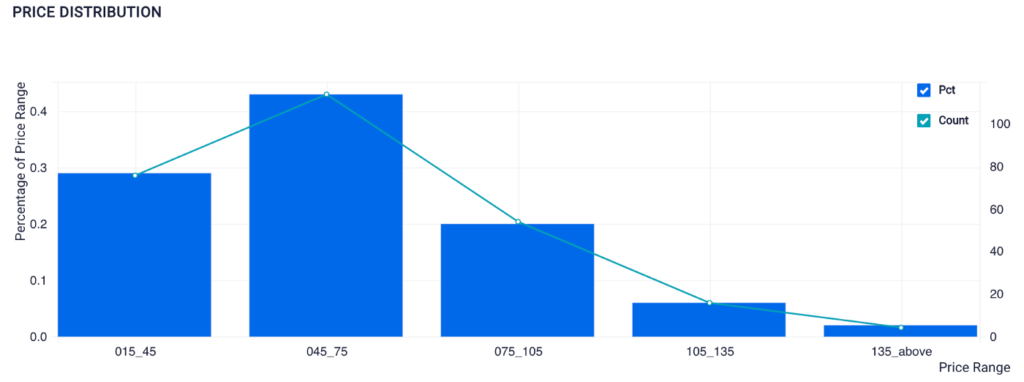
Visualization Created Using SQL on ScoreFast Platform (by Author)
From this plot, we know that almost half of the dresses listed on Backcountry.com are between $45 to $75 price range.
➡️ The Average price for Each Brand
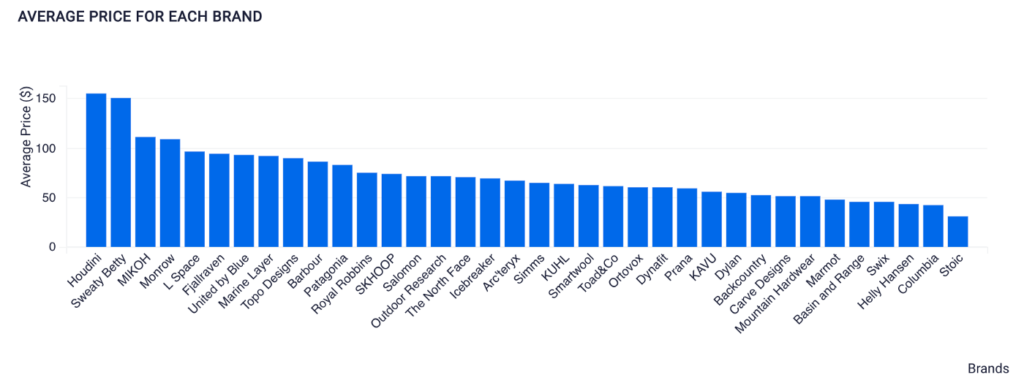
Visualization Created Using SQL on ScoreFast Platform (by Author)
We can see that Houdini has the highest brand’s average price, and Stoic has the lowest. We can conclude that Stoic dresses are more affordable while Houdini dresses are pricier.
➡️ Women’s Dress and Skirt Product Overall Rating Distribution
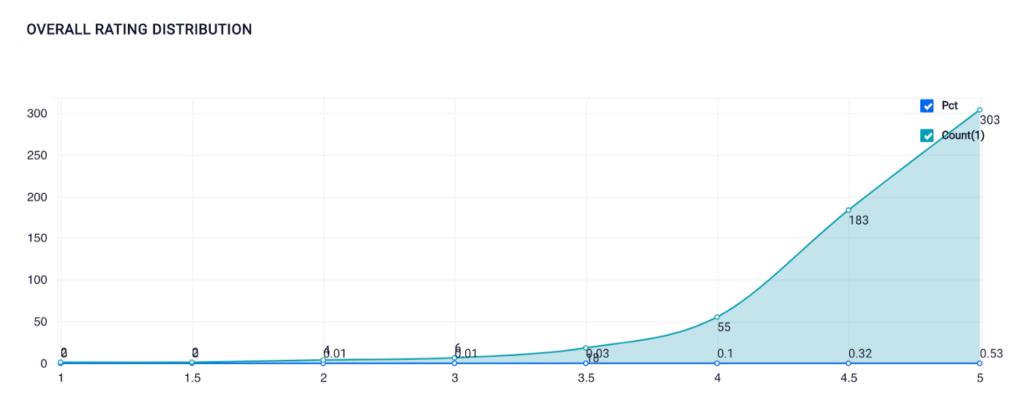
Visualization Created Using SQL on ScoreFast Platform (by Author)
A product’s overall rating is calculated by the sum of all the review ratings divided by the number of review count. Reviewers can only rate a product from 1 to 5. As expected, most products tend to have higher ratings. 53% of the products have five stars rating. The number of review rating increases as the rating score gets higher. Now let’s take a look at each reviewer’s rating distribution.
➡️ Product Reviewer’s Rating Distribution
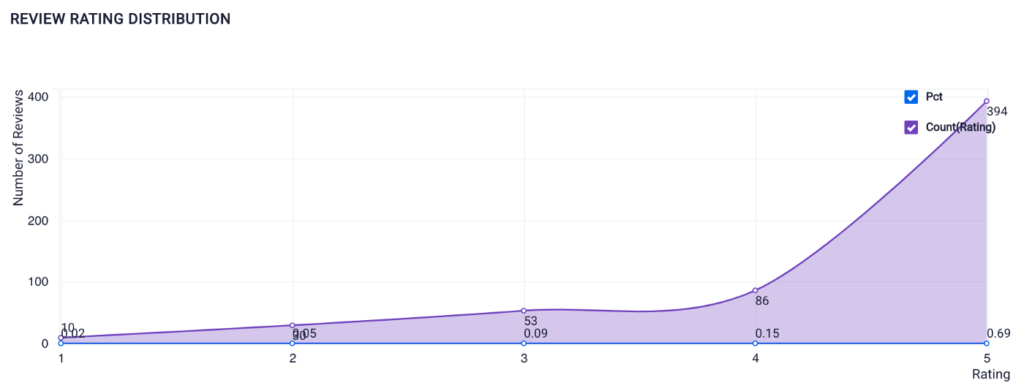
Visualization Created Using SQL on ScoreFast Platform (by Author)
We can see that in general, most reviewers on backcountry.com left pretty good reviews. This happens on many E-commerce websites, including Amazon.com. It’s possible that reviewers might get certain rewards from the vendors if they leave reviews. Another reason for an increase in review ratings is that more and more brands are investing in online review software to monitor their reviews, so they are actually improving their customer experience.
➡️ Product Review Count Distribution
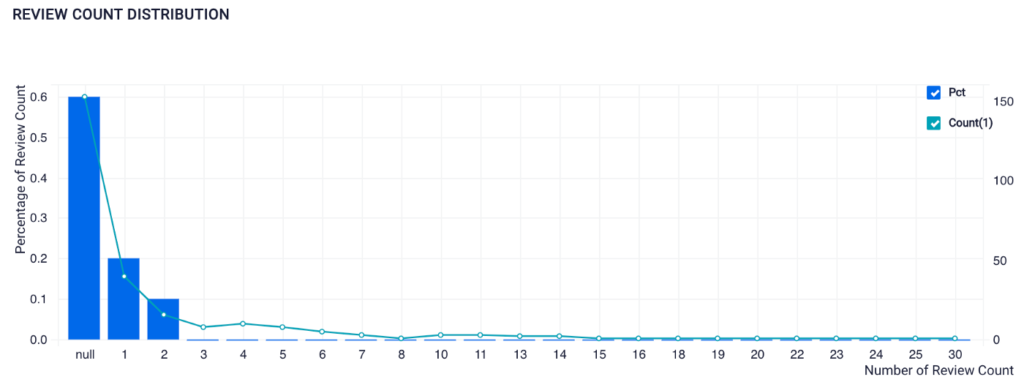
Visualization Created Using SQL on ScoreFast Platform (by Author)
From this dataset, a lot of the products have no reviews or very few reviews. Since I also wanted to run a sentiment analysis on the reviews later, I would need to gather more reviews.
➡️ Dress Fit Distribution across all brands
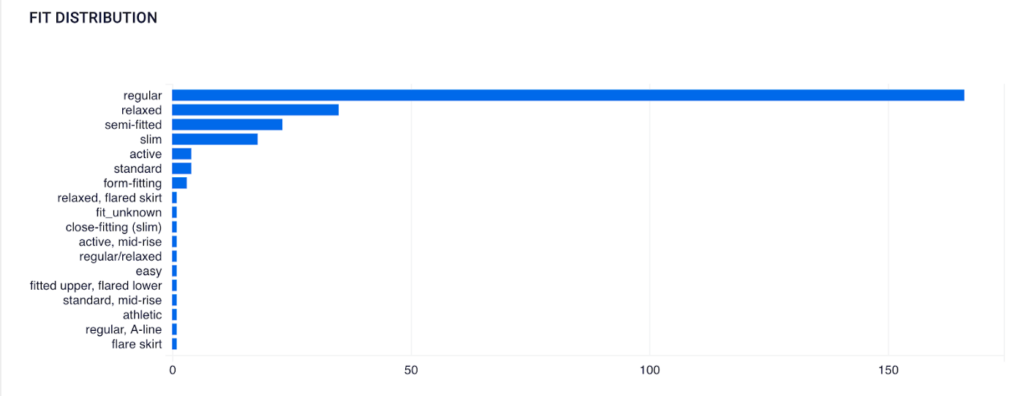
Visualization Created Using SQL on ScoreFast Platform (by Author)
One of the most common concerns for customers who would purchase clothing online is its sizing. From this plot, we see that the majority of the listed dresses are regular fitting. Since ‘regular’ shows up in various categories, later, we can use TF-IDF to create the text vector.
Text Vectorization
In order to use the KNN algorithm, we first need to convert text data into vectors. To do so, I used TF-IDF and Word2Vec. TF-IDF stands for Term Frequency — Inverse Document Frequency, a commonly-used method in information retrieval tasks. TF-IDF creates these vectors by weighing the terms by their prevalence across the documents. If a word occurs in almost all the documents in the corpus, then it’s likely that the word doesn’t carry too much helpful information. By adding the IDF part of the formula, we can ensure to lower the weight of an unimportant term in the text vector. I used TF-IDF on the product information only since TF-IDF vectors do not account for semantic similarities in language. To solve this problem, I used a word embeddings framework called word2vec on product reviews, which learns vector representations for words in a corpus.
Here’s a visual example with two reviews:
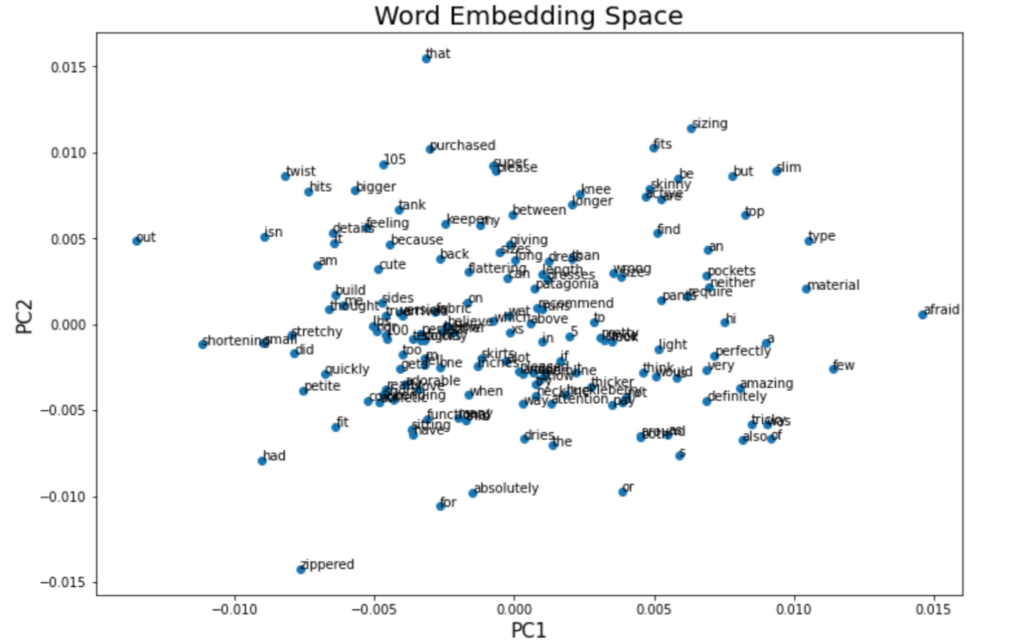
Visualization of Word Embedding Vectors using Gensim and PCA
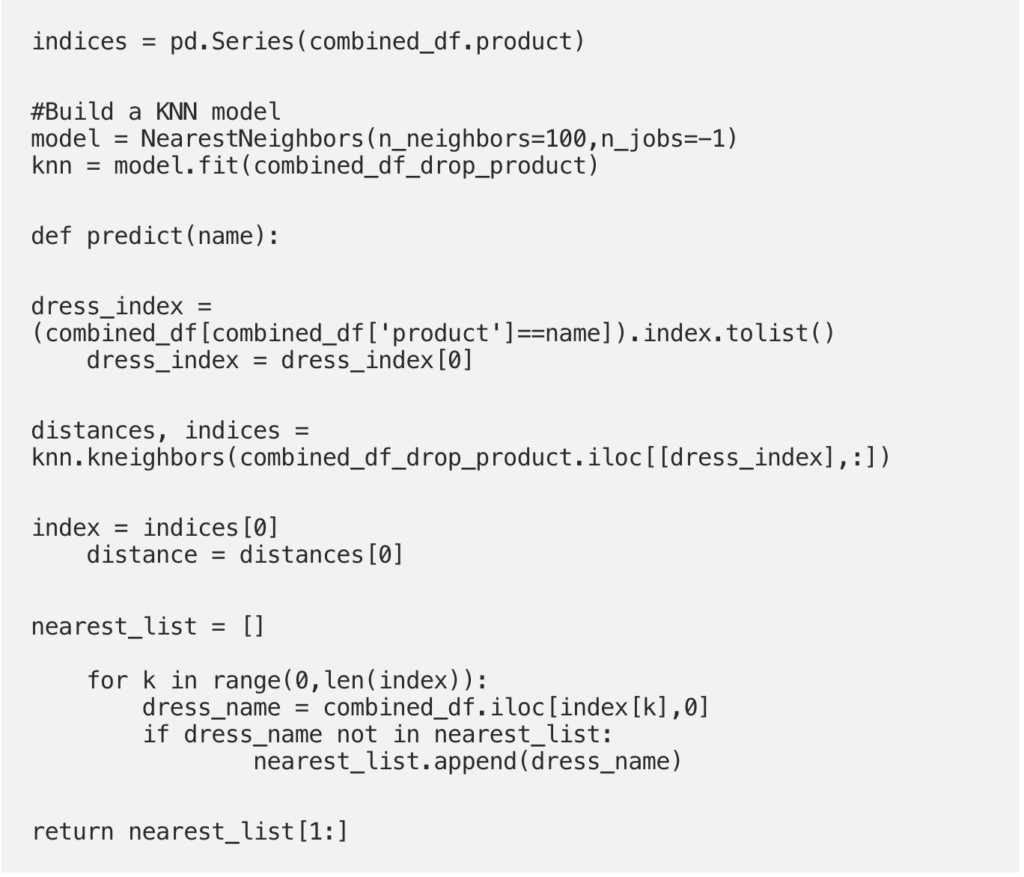
Build a KNN model
K-nearest neighbor (KNN) is a non-parametric, lazy learning method. It does not make any assumptions on the underlying data distribution; instead, it relies on item feature similarity. Thus, it’s usually used as a good baseline for recommender system development. KNN first calculates the “distance” between the target product and every other product in the dataset. It ranks its distances and returns the top K nearest neighbor products as the most similar product recommendations.
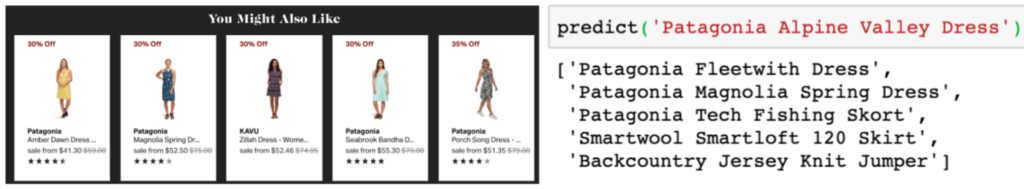
Patagonia Alpine Valley Dress’s Recommended Products from the site V.S the Model Prediction (by Author)
There you have it! We have successfully built a product recommendation system.
Product Reviews Sentiment Analysis
Sentiment analysis is extremely useful for E-commerce to gain an overview of the public opinion on their brand. By listening attentively to the customers and understanding customers’ needs and wants, brands are able to tailor products and services to meet the needs and develop a better winning business strategy.
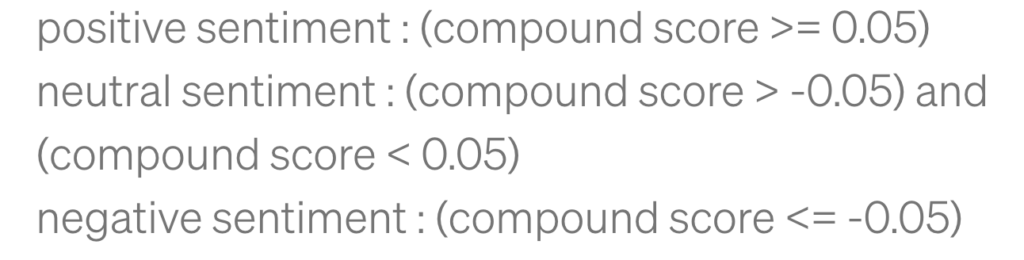
In order to build a more robust sentiment analysis model, I would need to gather more review data. Assuming the customers might be more likely to leave a review for popular brands, I decided to scrape all the best sellers product reviews for the nine most popular outdoor clothing brands. In the end, I extracted 27,700 reviews from 2676 products. Once I had enough reviews, I used VADER’s compound score to separate the reviews into five groups. VADER or Valence Aware Dictionary and Sentiment Reasoner is a rule/lexicon-based, open-source sentiment analyzer pre-built library, protected under the MIT license. VADER not only tells about the Positivity and Negativity score but also tells us about how positive or negative a sentiment is. The compound score is a metric that calculates the sum of all the lexicon ratings, which have been normalized between -1(most extreme negative) and +1 (most extreme positive).
Assuming a review’s rating is a reflection of its review content, a positive review should have a positive sentiment. But is that really the case? I created a word cloud for each compound score group and for each rating group to see each group’s keywords. Finally, I compared the keywords from each group to see if there existed any patterns.
➡️ VADER’s Compound Score Distribution
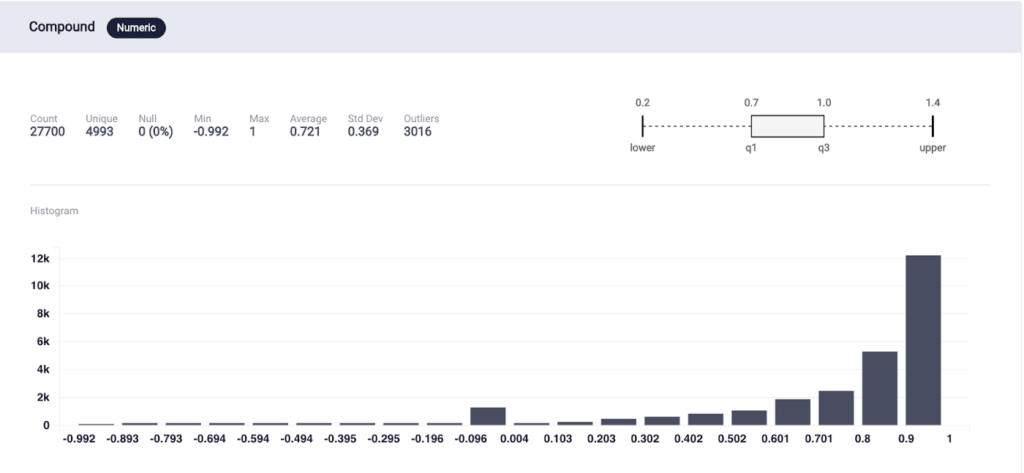
Visualization Created automatically on ScoreFast Platform (by Author)
☁️ WordCloud Rating Group for all product
WordCloud Generated by Author
☁️ WordCloud Rating Group for all product
WordCloud Generated by Author
Summary
- Customers tend to like products that have pockets, hoods, more color options, comfortable, lightweight, warm coat, and fleece material
Customers usually complained about the material, size, and zipper
Review Rating Prediction
For an experiment, I wanted to see if we can use a review’s sentiment compound score to predict its review’s rating.
Here’s the result of the simple regression models:
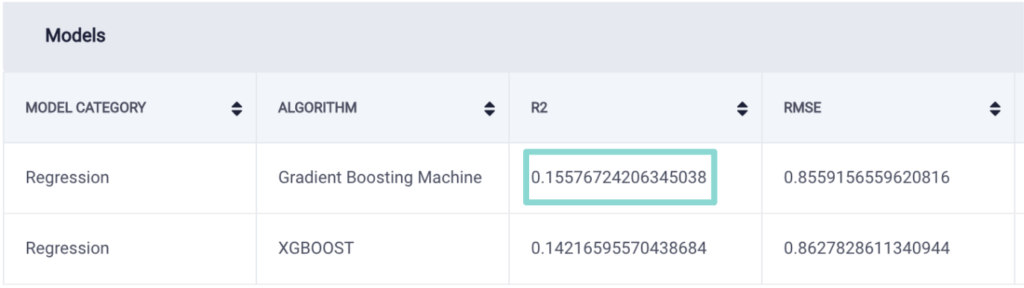
Built regression models on ScoreFast™
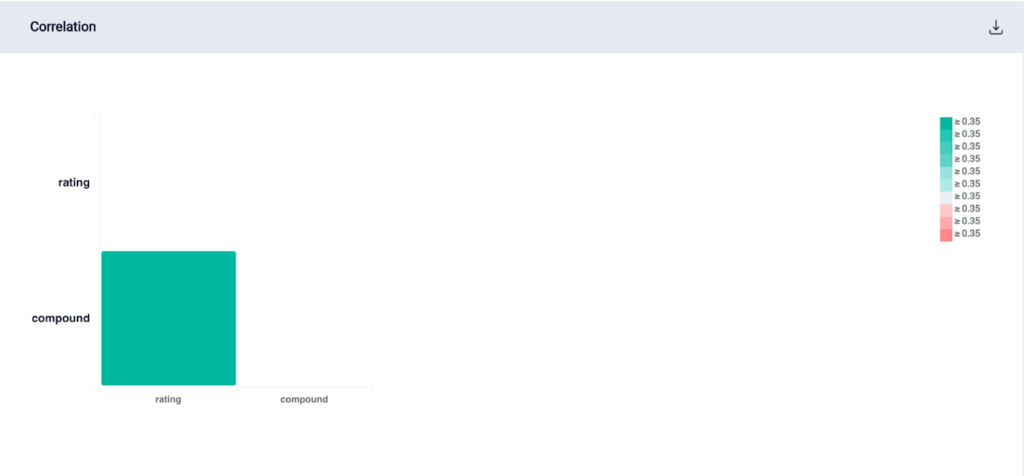
Correlation between review rating and its compound score (by Author)
As expected, the model didn’t perform too well since we don’t have enough input features. However, surprisingly, it turned out that sentiment score is not highly correlated with its review’s rating.
Final Thought
In this post, we briefly covered web scraping, content-based filtering recommendation system, and sentiment analysis. As my next step, I want to experiment with BERT — a pre-built word2vec model — to create a more robust and higher fidelity prediction model. I also would like to work on aspect-based sentiment analysis that returns people’s opinions based on a specific aspect.
I look forward to continuing my exploration of text data in the ScoreFast(™) system.
Acknowledgment
I want to thank Kaushik Vasudevan, Prasanta Behera, and the ScoreData team for giving me feedback on the blog.