Generating Synthetic Datasets for Predictive Solutions
Introduction
I am an intern currently learning data science. I initially learned how to navigate, analyze and interpret data, which led me to generate and replicate a dataset. I wanted to go through a use case E2E.
To calculate and analyze sentiments of text-based data in my prior projects, I retrieved data from public sources such as social media and Machine Learning repositories. For this project, my objective was to generate data using a tool such as ”faker”.
This project’s use case is to simulate data similar to data from food delivery services (such as DoorDash, UberEats, etc). The purpose of using fake data is to hide any sensitive data. The data production starts transcribing a call between a caller and an agent, where details about the call such as call date and time are recorded. Objectives also include gauging the sentiment of the conversation. The conversation also may include a threat to complain on social media about the caller’s concerns. If a customer tweets about their experience, the sentiment of the tweet is calculated.
Goals of the project:
- Create data to replicate actual customer use case using pandas
- Build a model and do predictions
- Analysis of conversation between caller and agent
- Calculate and analyze the sentiment of the call text and tweets
Data Generation
To simulate the use case, a sample dataset with at least 1000 rows was generated. The data contained features such as agent’s name, details about the order (order number, date, order type, items ordered, and total price), details about the call (date, duration, and the call text), and details about the caller (name, age, gender, and location).
In order to generate data in an automated way, faker() was used to generate the following variables.
Variables:
- Agent name: a list of 10 fake names (so there are no repeat random agent names)
- Food items: a list of all the food items on the menu
- Prices: maps food items to their prices
- Call text: text options that the caller would say*
- Response text: text options that the agent would say
*feedback was generated with reference to Yelp reviews
How faker was used:
Pandas was used to create a dataframe called “df” with 1000 rows and columns for each specific feature such as Agent Name and Order Number.
![]()
For generating the agent name, fake.name() was used to create a list of 10 fake names which was randomly called from. fake.name () was used once again for the caller name.

The following graph portrays that the distribution of the randomly generated “Agent Names” was relatively equal.


fake.numerify() was used to create text in the format ###-### for the order number, and ## for the caller age.


For order date, fake.date() and fake.time() were used, and then the values were converted to strings.


fake.city() was used to generate random cities for Location.


fake.word() was used to select random phrases from the ‘calltext’ list and ‘responsetext’ list to form a dialogue/conversation for Call Text.

Challenges of generating fake content:
One of the challenges that I faced was finding an efficient way to create order details such as price calculation. The solution included creating a function that was applied to the entire column:
- First, a random food item from the list “items” is chosen and added to the order.

- Second, the item’s price is found in the dictionary, and added to the total price of the entire order.
![]()
- Third, A tally is added to the column associated with the item name.

- Fourth, the order is labeled as food/drink based on the column number.

Order Type distribution result:

Additional data features:
The sentiment of the call text and tweets were measured on a scale of -1 to +1.
In efforts to make the data generation more concise and efficient, I calculated sentiments for the Call Text column.
![]()
Analysis of Generated Data

Table 1: Dataset
Verifying the distribution of data:
There are multiple steps I took to verify that the fake data generated was “random enough”.
Initially, while assigning agent names randomly, certain names were repeating 1-2 times while the rest were unique. To make this as random as possible,I created a fixed list of agent names, and called “Agent name” from that list. This helped control the number of random names.
Then, by checking whether the number of orders of each item was random with no outliers, it was certified that each item had an equal chance of being ordered.

Graph 1: Displays that item choices are random since the number of occurrences of each food item is within the range of 63-100
Next, generating the histogram graphs of Call Duration and Call Date portrayed that the data is random enough since there is an equal distribution of data, and it is not skewed towards any interval of call date.

Graph 2: Distribution of Call Duration

Graph 3: Distribution of Call Date
Lastly, I checked if the sentiments of the generated Call Texts and Tweets were distributed equally.

Graph 4: Distribution of Sentiment

Graph 5: Distribution of Tweet Sentiment
Predictive Models
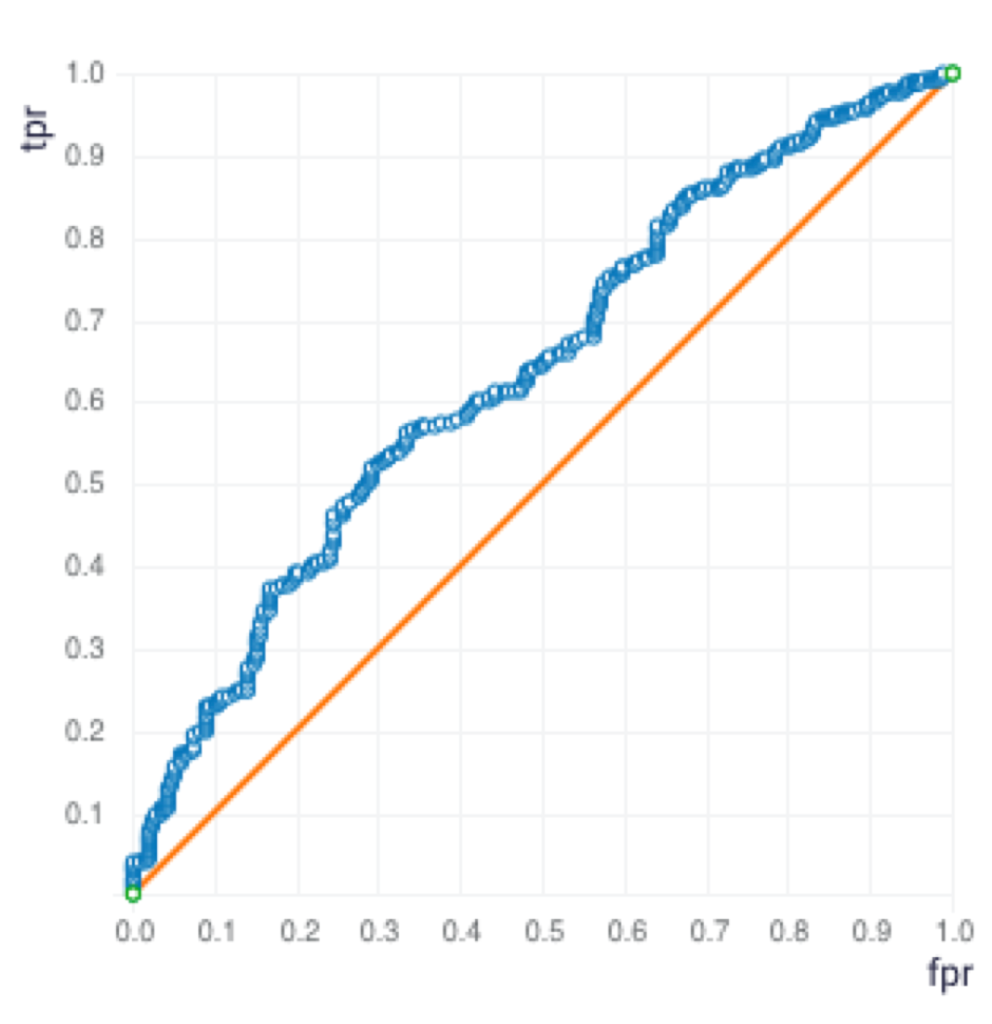
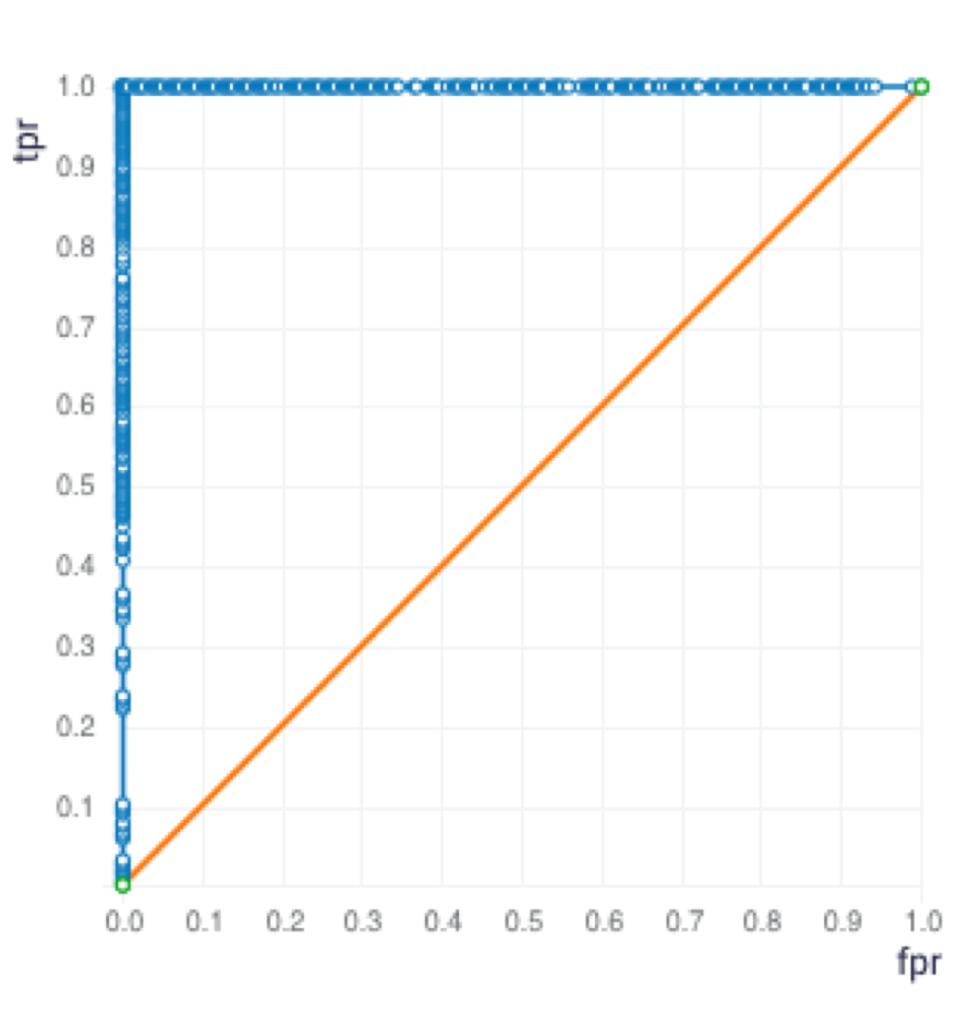
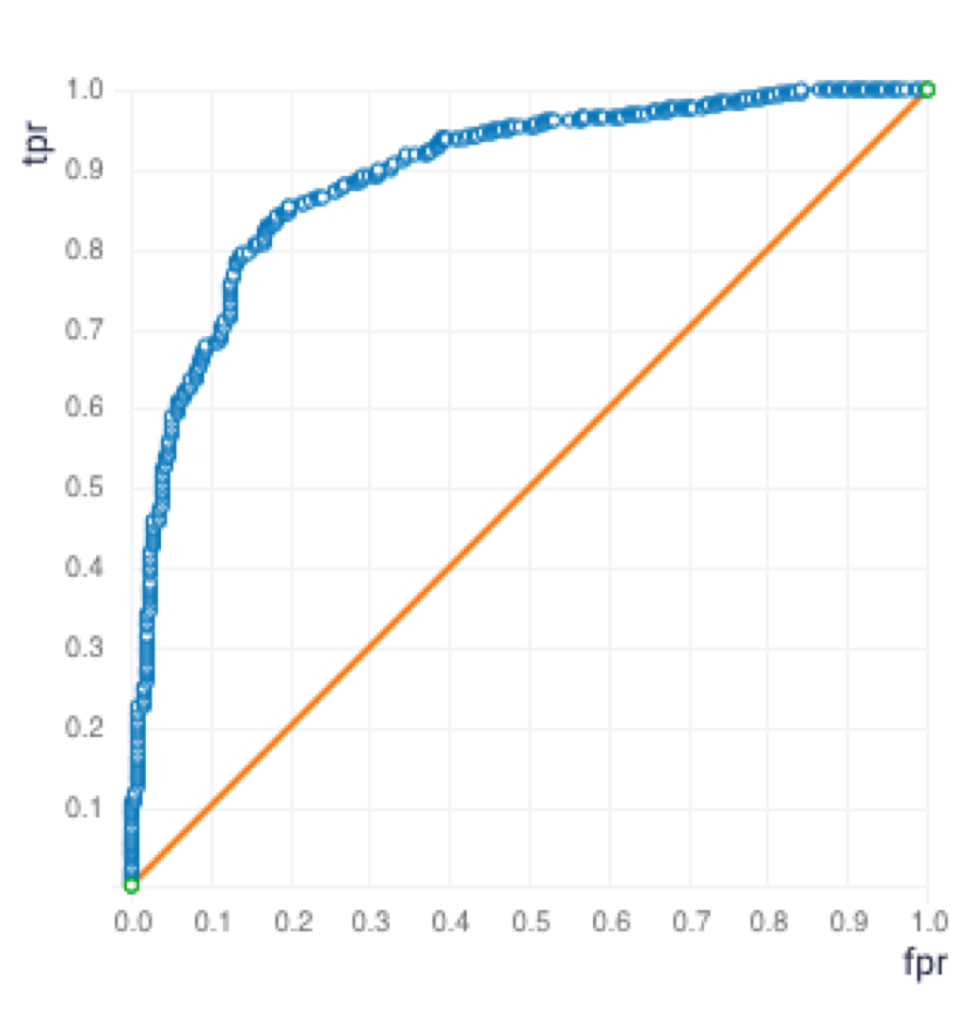
After the data generation and analysis, the next step is to build predictive models. The data was randomly split into two sets, train and validation, with a 70:30 ratio. I used three different algorithms on the ScoreFast(™) platform and built the following models.

Graph 6: Generalized Linear Model – ROC Curve

Graph 7: Gradient Boosting Machine – ROC Curve

Graph 8: Distributed Random Forest – ROC Curve

Table 2: Confusion Matrix with Threaten Flag used as the response variable
Since the Precision and Recall are both the highest for the GBM model, the GBM model was selected. The GBM Model was used for the following sample input data for prediction.
Prediction:


This predicts a 40% chance of the Threaten Flag being 1. 1 means that the caller will threaten to post on social media.
Summary
This project taught me the bigger picture of how to create a dataset with a use case. It taught me how to import and use pandas, a data structures and data analysis tool, to create a dataframe. I was able to learn and understand how to use Faker to generate values such as: fake name, phone number, date, time, and a city location. In order to increase code efficiency and organization, I created correlation-based functions and applied sentiment for a whole column using textblob. I look forward to exploring more about the Faker class, and its use cases to accurately replicate and generate fake data. In the future, I would like to understand the details of sentiment analysis, so I can analyze for correlation and patterns. I look forward to continuing to work in other fields with sensitive data.
