
Market Basket Analysis: Medical Equipment Sales
In today’s Predictive Analytics-driven era of empowering decision makers, businesses find that those who have the most up-to-date relevant customer-specific information at their finger-tips are better able to serve their customer’s needs. If Managers can see an up to the minute profile of customer needs then they can recommend products or offers that more suited to businesses’ goals: revenue optimization, profit maximization, inventory clearance, customer satisfaction, etc.
Imagine a hospital buyer who ordered parts for hospital beds, and who now wants to order a swing out table, a patient’s harness or a clipboard stand from the vendor. It may be impossible for the vendor’s call-center agent or sales person to suggest these products as the vendor may have hundreds of related items in their portfolio. Salesperson or agent at the vendor site may need to know various permutations and combinations of items that go with hospital beds, right at their finger tips.
This is where ScoreData’s ScoreFast™ can help. By optimizing product part combinations with the hospital’s needs, vendors will be able to maximize customer satisfaction as well as ensure sale of parts that most need to be sold for inventory movement or profit increase. ScoreData’s models can help optimize inventory or maximize profits.
Market Basket Analysis is a technique to identify the best possible combinations of products or services, which are frequently bought by customers. If salespeople or contact center agents have access to these combinations then they can quickly make recommendations. The underlying ScoreFast engine collects information about the hospital buyer’s habits and determines that if hospital buyers order parts for hospitals beds and patient’s harness then they are also most likely to buy clipboard stands.
A typical analytics goal when applying market basket analysis is to produce set of association rules in the following form:
IF { Hospital bed parts, patient’s harness } THEN clipboard stand
The first part of this rule (L.H.S.) is called “antecedent” and the second part (R.H.S.) is called “consequence”.
The outcome of this analysis is a set of such association rules. It uses the Apriori Algorithm [1] to generate these rules. The rules are used to make recommendations to customers.
Basic terminology of Market Basket analysis
Items are the objects that we are finding associations between. For a retailer each product in the shop is item, products or services purchased on a credit card in a month are items, products purchased in a single purchase order are items.
Transactions are instances of groups of items purchased together such as items in a shopping cart in a grocery store, items mentioned in a single purchase order or items in a monthly credit card bill.
Support: The percentage of transactions having a particular item or item set in the transactional database is known as its support. It is the probability of occurrence of the item or item set in the database.
Confidence : It determines the operational usefulness of the association rule. Transactions with confidence more than 50% are selected. It is measured as the ratio of Support of all items to the support of antecedent.
For example Support(Milk, Sugar and Coffee) / Support(Milk and Sugar) is Confidence (Milk and Sugar →Coffee).
Support(Milk, Sugar, Coffee) means percentage of transactions having Milk, Sugar and Coffee, and let say it is 40%. Support (Milk and Sugar) means percentage of transactions having Milk and Sugar, say 60%. The confidence will be 40/60 i.e. 66.67%. So, it is the conditional probability of the consequence given the antecedent..
Lift: The third measure Lift is defined as the probability of all items in a rule occurring together divided by the product of the probabilities of items on left and right as if there was no association.
It is the ratio of the conditional probability of the consequence to its absolute probability.
Lift tells us how much better the rule is at predicting the result than just assuming the result in first place. In case of Milk, Sugar and Coffee, if coffee appears in 20% transactions then Lift = .4/(0.6*.2) = 3.33.
If Lift > 1 then the rule is better at predicting than guessing. If Lift < 1 then the rule is worse than guessing.
Overall Lift gives the strength of association between the products of the left (antecedents) and right hand sides (consequence) of the rule; the larger the lift, the greater the link between the two items.
Apriori Algorithm
Apriori is an algorithm for frequent item set mining and association rule learning over transactional databases. It uses a “bottoms up” approach, where the frequent subsets are extended one item at a time – a step known as candidate generation. The candidate item sets are tested against the data.
As a first step scan the transactional database to get the support S of each 1 item set, compare it with minimum support. Prune the 1- items sets by excluding the 1 – item sets having support S less than minimum support. Minimum support can be set depending on the number of transactions in the database (say 10%). The 1 – item sets having support S more than minimum support are known as frequent item sets or candidate item sets.
In the second step we find the support for 2-item sets by scanning the transactional database. Again we prune the 2-item sets having support less than minimum support and generate the frequent 2-item sets.
We continue this process for 3, 4, …..to k item sets and keep pruning the item sets till we get null k-item set.
The frequent item sets determined by Apriori can be used to determine association rules which highlight general trends in database.
Case Study
We will split this case study in two parts:
- First we build the required association rules
- We deploy the rule engine to generate recommendations
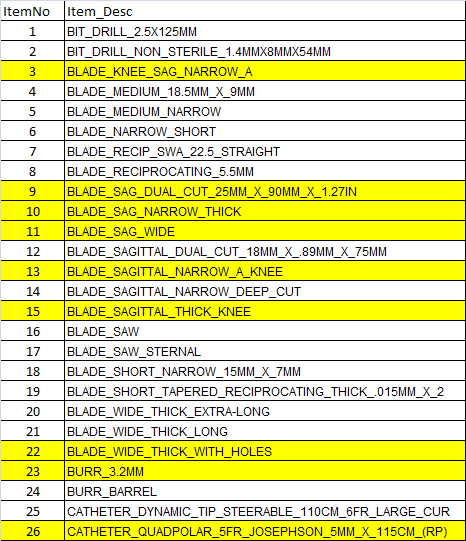
- This case study deals with data of medical equipments purchased by a hospital from various vendors. In this case Market Basket is defined as the equipments (Items) purchase by hospital in single purchase order.
- A total of 26 items were tracked
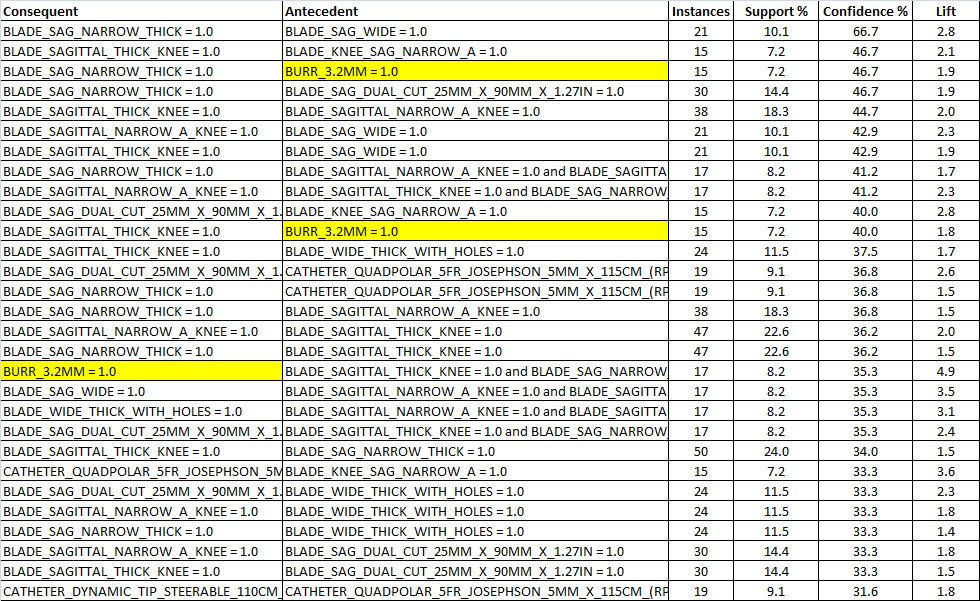
On running the Apriori algorithm the two-three item combinations were listed with instances, support, confidence and Lift. These pairs are listed in order of confidence as shown in the following table:
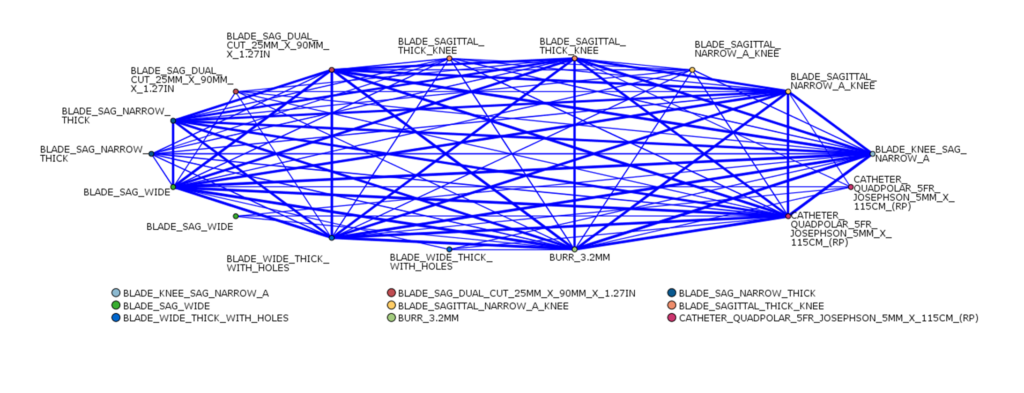
Based on the above report 9 items involved in top combinations are taken and a web chart is created which shows all possible combinations. The dark lines indicate strong associations and light lines indicate weak associations. The following web chart shows all possible combinations:
We can show the frequently occurring combinations by choosing a threshold. After choosing a threshold we are left with few associations as shown below:
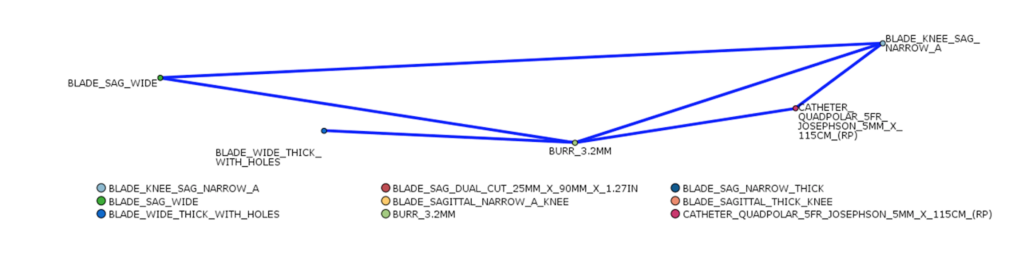
These combinations are listed below and occur in many purchase orders.

Applications of Market Basket Analysis
A Market Basket Analysis conjures up images of shopping carts and shopping malls. However there are many other applications for Market Basket Analysis, such as:
- Credit Card purchases
- Up-Sell and Cross-Sell more effectively
- Analysis of Telecom Services purchased: Once we know the services which are bought together most often. They can be sold in bundle at a discount to more subscribers.
- Product placement: The items associated with each other can be placed near to each other on a shelf in super-market
References
1. R. Agrawal and R. Srikant, Proc. 20th Int. Conf. on Very Large Databases (VLDB 1994, Santiago de Chile
Satish Belani heads India Operations for ScoreData Corporation. Prior to ScoreData Satish led teams at Datamatics Corporation and Nielsen Analytics